
PLANNED TESTING
Considering there are 3 main tests that this project will focus on, each sub-procedure will be explained below:
System Comparison:
For establishing the power generated by each system, initially the data will be obtained from the device when it operates as intended (Trail 1). A Multimeter will be used to record the data. Next, the system will be re-programmed to set the vertical axis to the maximum angle of incident, while the horizontal axis will continue to perform as intended (Trial 2). The data will be recorded then, a final test will be performed with the device re-programed to a fixed position (Trial 3). All the data will be comprised in an excel spreadsheet and used to establish a critical analysis of the results.
Angle & Tolerance:
This testing will be performed during the initial operation of the device as intended. Markers will be placed on specific points on the horizontal and vertical axis to be referenced as milestones that the system should reach. For example, If the device should reach 45 degrees by 3 p.m. on the horizontal axis then that may be used as one of the markers. All data will be recorded by hand, and the error percentage will be calculated based on the actual position of the axes at the milestone times.
System Efficiency
This test will be carried out by first initially, recording the voltage rating of the battery prior to testing and then once again at the end of the testing (Trail 1). The change in voltage will either reflect the efficiency of the system, based on how much energy is redistributed back to the battery or how much energy was used to run the system. This can be severely affected based on the weather conditions of the test day, and that will be factored into heavily during this test.
A standard tape measurer has tolerance of 1/16th inch and this is will be reference if a tape measurer is required. The Fluke Multimeter is also considered as it generally has tolerances to the .005 voltage and current. The data for most of the test will be collected on paper and then later transferred to a Word and Excel document.
TEST ONE FOOTAGE
.png)
TEST ONE RESULTS
This portion of the project is a combination of electrical system development and testing simultaneously.
The first test developed for the current state of the device ensures the functionality of the motor drivers and the operating constraints for programming as well as the literal operations of the system.
The test data for this first test can be viewed above. Test 1 was a trial and error method of using various programs to understand which coding formats worked best for the system. The actuator testing used the change in position of the actuator and of the frame’s relative position to determine the maximum and minimum angle of declination. Also, it established the operating speed which were important for documentation and for a more efficient program. The results were very similar to the calculated value except for the max actuation length, about 1 inch short.
The DC motor was unable to be tested during this time. The current reasoning is that there is too much load on the motor shaft adapter. The bolts that fixed the frame had also been stripped and without the proper tools to remove them, and reduce the load, the motor will have to be tested later.
However, the information is valuable to the project moving forward as it highlights room for improvement. The motor testing will address any areas of interference between wires or the motion of the axis as well as the time to complete revolutions.
TEST TWO
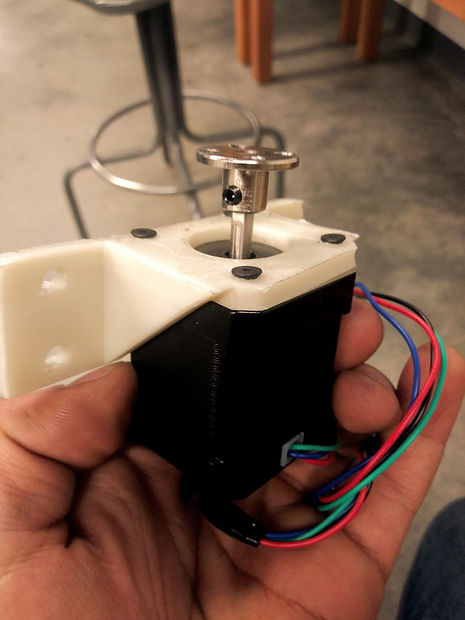
Motor Function
Motor Results:
The motor test was meant to observe the interference frequency, speed, and time during one full revolution from the start position. However, the motor test has been deemed a failure due to several discrepancies. Initial test of the motor before installation to the system worked well but was unsuccessful when used in application.
Observation:
The motor would not move the system with all the components assembled and as a result, to better understand the issue, components were removed incrementally to see how much weight it could rotate. However, once all components except the platform it’s mounted to were removed, the motor still would not rotate. The motor created a loud clicking sound that was determined to be either a slipping within the shaft adapter or within the motor itself.
Analysis: From the information gathered there was either an issue with how tightly fastened the adapter was to the motor shaft or that the radial load was too much to overcome. Since the motor was operational with all programs outside of application, the issue must me mechanical. Further calculation is required to determine if a stronger motor is needed also.
Outcomes:
Following this test further analysis of the decide the loading was concluded as the issue. Therefore, the require torque to rotate the system must be redetermined. The rotational inertias of each component will be calculated then used along with the masses collected to calculate the torque. Once these are established, with the new torque calculation an analysis of current motor can establish the appropriate step to move forward. The initial idea is to construct a drive train or gear box to improve the torque, if viable.
Power Efficiency
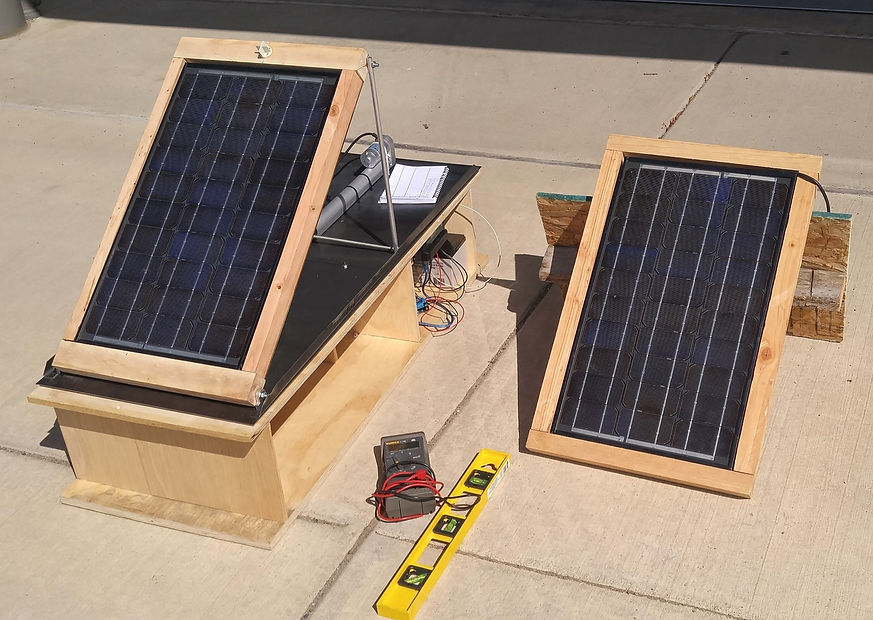
Following test two, the power efficiency of the system using the solar panel was still the main focus. Since the motor was not operational, the azimuthal axis was repositioned manually with the assistance of a digital compass and sun tracking data for improved precision and accuracy. The actuator was operational which made repositioning the altitudinal axis feasible. Also, during the same time period an additional solar panel was set up at a fixed position to establish comparable data between both types of systems. The data was compiled over a 5-hour period and provided successful results for the dual-axis tracking system which can be referenced in Appendix G. An in-depth summary of the analysis can be referenced in Appendix I. Also, after an analysis of the device was conducted it was concluded that there was a miscalculation of the torque required to turn the azimuthal axis. Therefore, in an effort to ensure the device became operational a new torque calculation was determined using a stepper motor program with constraints similar to this system (index table). From there a new motor with the appropriate specifications was located. All other necessary components for mounting were purchased and the necessary modifications will be made prior to the final presentation of the device.

RESULTS
The decision was to purchase the planetary gear system motor as it required less energy to operate while still providing the same results. A NEMA 17 stepper motor with a 100:1 gear ratio was purchased through Amazon along with new mounting brackets. The cost of these modifications came to a total of approximately $59.50.
After conducting several tests and making a few modifications to the device, it can be said that the project was a success. The completed analysis of the data can be referenced in Appendix G which will show that the dual-axis tracking system outperformed the fixed system by 38.9% which is 13.9% higher than the anticipated 25% increase. An in-depth analysis of validation for these results can be referenced in Appendix L under the Testing & Results section. Also, both the actuator and motor have been adjusted so that they are both fully autonomous. For an end project comparison, all the design requirements and results are listed below:
Design Requirement: Result (Goal)
Energy Output: 102.4W (100W) Success / Fail
Energy Increase, Over fixed system: 38.9% (25%) Success / Fail
Tolerance: +/- 3% (1-3%) Success / Fail
Total working hours: 250 (250) Success / Fail
Total Costs: 246.41 ($250) Success / Fail
Max Weight: 100lbs (66.4 lbs.) Success / Fail